BALTIMORE (Stockpickr) -- In case you missed the memo, October has been a stellar month for stocks. Since the start of the month, the S&P 500 has managed to shove its way 4.8% higher, tacking on some serious performance onto an already solid 2013. But most investors wouldn't know it.
After all, with all the drama surrounding the government shutdown, the bickering over the next Fed chairman and the anxiety over pared down earnings expectations, investors could be forgiven for not noticing the upside action. None of that changes that the S&P closed at new all-time highs yesterday.
Yes, this is still very much a "buy the dips" market.
So to take full advantage of the strength in stocks, we're taking a closer technical look at five individual names with breakout potential this week.
For the unfamiliar, technical analysis is a way for investors to quantify qualitative factors, such as investor psychology, based on a stock's price action and trends. Once the domain of cloistered trading teams on Wall Street, technicals can help top traders make consistently profitable trades and can aid fundamental investors in better planning their stock execution.
Without further ado, let's take a look at five technical setups worth trading now.
Mohawk Industries
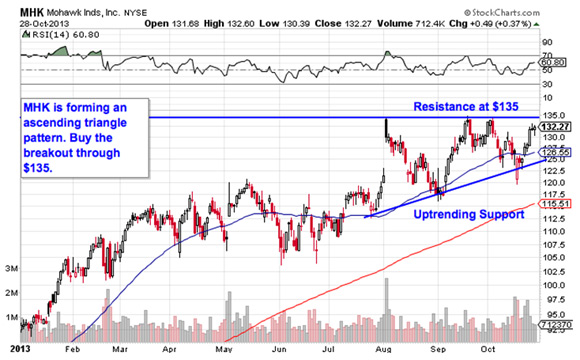
First up is $10 billion flooring maker Mohawk Industries (MHK). 2013 has been a stellar year for shares of Mohawk, with the stock rallying more than 46% on the strength of the housing sector.
But don't ignore this stock just because you missed the move. MHK looks well-positioned for more upside in 2013.
That's because Mohawk is currently forming an ascending triangle pattern, a bullish price setup that's formed by a horizontal resistance level above shares (at $135 in this case) and uptrending support to the downside. Basically, as shares of MHK bounce in between those two technical price levels, they're getting squeezed closer and closer to a breakout above resistance. When that breakout happens, it's time to be a buyer.
Shares have gotten swatted down on each of the last four attempts at the $135 level. That glut of selling pressure makes a move through it all the more significant. We could see another test of $135 happen this week.
HanesBrands
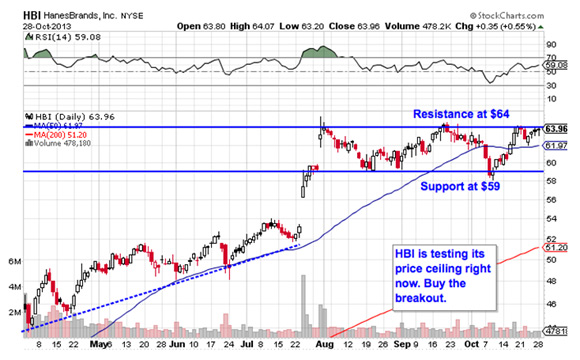
HanesBrands (HBI) is another name that's posted stellar performance in 2013. But the past few months have been relatively flat for shares of the apparel maker. Here's how to trade it.
HanesBrands has spent the last three months in a rectangle pattern, a price setup that's formed by a horizontal resistance level above shares at $64 and another horizontal support level down at $59. The rectangle gets its name because it essentially "boxes in" shares -- but like the setup in MHK, the buy signal comes on a breakout through the top of the channel at $64. HBI is testing its breakout range in today's trading session.
Whenever you're looking at any technical price pattern, it's critical to think in terms of those buyers and sellers. Rectangles, triangles and other pattern names are a good quick way to explain what's going on in a stock, but they're not the reason it's tradable. Instead, it all comes down to supply and demand for shares.
That $64 resistance level is a price where there has been an excess of supply of shares; in other words, it's a place where sellers have been more eager to step in and take gains than buyers have been to buy. That's what makes a breakout above it so significant. The move means that buyers are finally strong enough to absorb all of the excess supply above that price level.
Don't be early on this trade.
URS
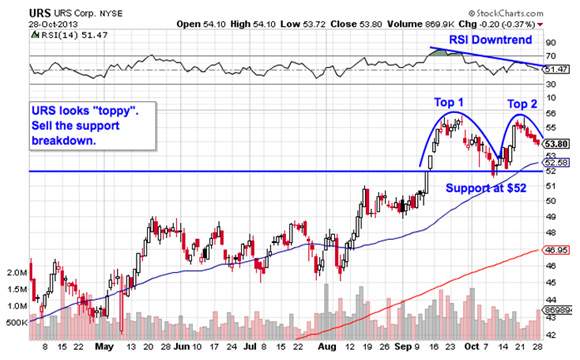
Despite the broad market's bullish bias right now, not every name looks equally strong. URS (URS) makes a good case in point. While the $4 billion engineering stock has fared well year-to-date, it's starting to look "toppy" from here.
The double top pattern is a price setup that's formed by two swing highs that peak at the same level. Those two tops happened in early September and then again in the middle of this month. A move through $52 is the signal that it's time to be a seller in URS. While this stock still has a little while to go before it goes into bear mode, I'd be paying close attention to that $52 support line if I were a shareholder in this name.
The inverse head and shoulders pattern is a reversal pattern that indicates exhaustion among sellers. It's formed by two swing lows that bottom out around the same level (the shoulders), separated by a deeper low (the head). The buy signal comes on a move through the neckline, which is right at $950. The fact that NVR's neckline level comes right at a big round number price is significant; it means that if shares can catch a bid above $950, more investor eyes are going to be fixated on a move through that level.
Here again, momentum adds some confidence to this trade. RSI has been in an uptrend since the pattern started forming in shares, and it's held that uptrend on the pullbacks. Since momentum is a leading indicator of price, there's clearly an upside bias in this stock right now.
Telecom Argentina
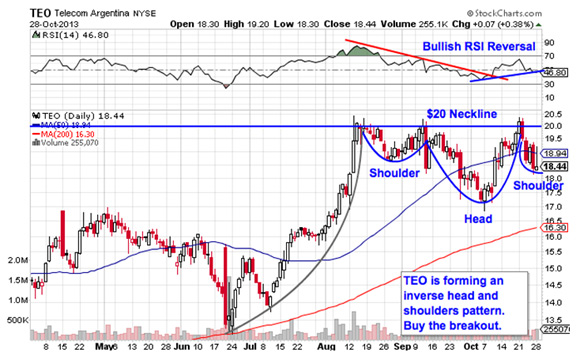
We're seeing the exact same setup in shares of Telecom Argentina (TEO) right now: Just like NVR, this mid-cap Argentina-based telco is forming an inverse head and shoulders setup. The key difference with TEO is the fact that the pattern is coming in at the top of this stock's recent range, rather than the bottom That's not a textbook setup, but the trading implications are exactly the same.
10 Best Bank Stocks To Watch Right Now
TEO's neckline level is right at $20. If shares are able to hold a move through that $20 price level, it makes sense to be a buyer in this Latin American communications stock. After that, I'd recommend keeping a protective stop on the other side of the 50-day moving average.
To see this week's trades in action, check out the Technical Setups for the Week portfolio on Stockpickr.
-- Written by Jonas Elmerraji in Baltimore.
No comments:
Post a Comment