BALTIMORE (Stockpickr) -- We'll be another week closer to the end of 2013 trading after tomorrow's close. And while December's market sessions haven't exactly started off with fanfare and frenzied buying, stocks are still slated to close the year on a high note.
With 25.7% gains in the S&P 500 year-to-date, the big index is currently on track for its best year in a decade.
But just because there's less than a month left in the year doesn't mean that investors should just operate on autopilot for the rest of 2013; there are still some big trading opportunities squeezed into the last three weeks of December. That's why we're taking a technical look at five big-name trades to take this week.
If you're new to technical analysis, here's the executive summary.
Technicals are a study of the market itself. Since the market is ultimately the only mechanism that determines a stock's price, technical analysis is a valuable tool even in the roughest of trading conditions. Technical charts are used every day by proprietary trading floors, Wall Street's biggest financial firms, and individual investors to get an edge on the market. And research shows that skilled technical traders can bank gains as much as 90% of the time.
Every week, I take an in-depth look at big names that are telling important technical stories. Here's this week's look at five high-volume stocks to trade this week.
Wells Fargo
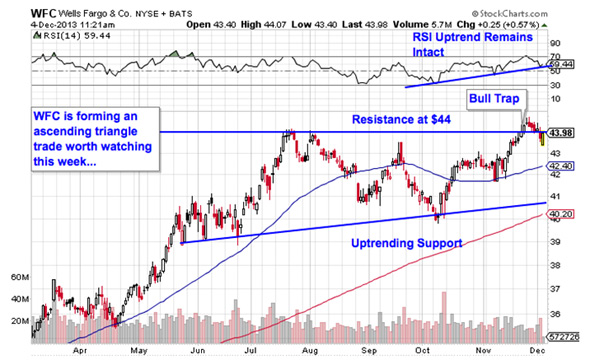
Big bank Wells Fargo (WFC) has more or less kept pace with the broad market in 2013, even with the sideways trading rut that shares have been stuck in since July. But those gains could accelerate before year-end; Wells looks positioned to recapture the rally from the first half of the year.
That's because Wells Fargo is currently forming an ascending triangle pattern, a bullish price setup that's formed by a horizontal resistance level above shares (at $44 in this case) and uptrending support to the downside. Basically, as WFC bounces in between those two technically important price levels, it's getting squeezed closer and closer to a breakout above $44. When that happens, we've got a buy signal in the bank.
Despite the "bull trap" in shares last month, momentum has held its uptrend, signaling that a more substantial move through $44 is on the way. When it happens, keep a protective stop under $40.
Citigroup
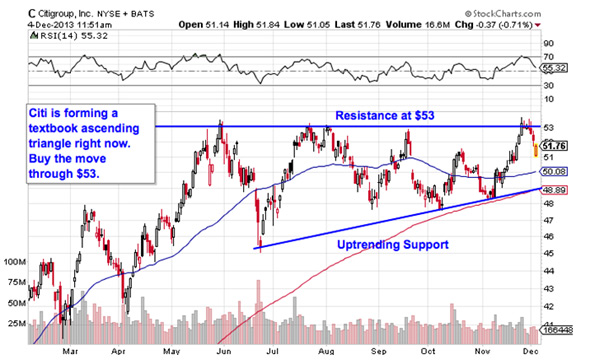
We're seeing the exact same price setup in another big name right now: Citigroup (C). Since Citi and Wells Fargo occupy the exact same space, it's not hugely surprising that the two stocks are showing traders the same price setup -- in fact, it's likely the breakout will happen in both names, not just one. For Citi, the level to watch is $53. A push through that price ceiling is a buy signal for the $157 billion financial firm.
Whenever you're looking at any technical price pattern, it's critical to think in terms of those buyers and sellers. Triangles and other pattern names are a good quick way to explain what's going on in a stock, but they're not the reason it's tradable – instead, it all comes down to supply and demand for shares.
That $53 resistance level is a price where there has been an excess of supply of shares; in other words, it's a place where sellers have been more eager to step in and take gains than buyers have been to buy. That's what makes a breakout above it so significant. The move means that buyers are finally strong enough to absorb all of the excess supply above that price level.
The 200-day moving average has been a pretty good proxy for support lately – that's where I'd recommend keeping a stop loss.
Fomento Economico Mexicano
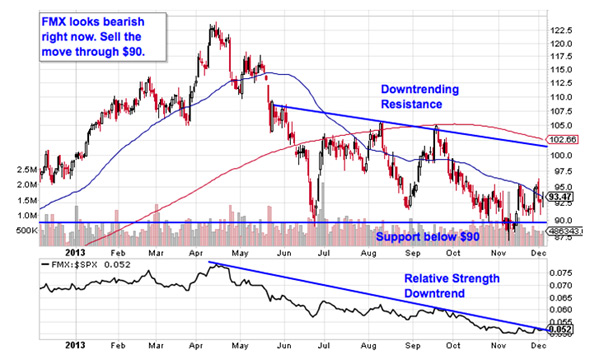
Fomento Economico Mexicano (FMX), better known as FEMSA, isn't another ascending triangle trade this week, unfortunately for shareholders. Instead, FEMSA is currently forming the bearish opposite of the pattern in Wells Fargo and Citi: a descending triangle.
The descending triangle is formed by downtrending resistance above shares and a horizontal support level to the downside. In this case, that price floor comes in just below $90. The lower highs that form resistance in FMX signal that buying pressure is waning above the $100 level as long-suffering sellers opt to take gains near the high-end of this stock's recent range. Once that glut of demand at $90 gets taken out, a lot more downside looks likely for FMX.
Top Blue Chip Stocks To Invest In 2014
But now, MTB is forming a rounding bottom, a bullish setup that indicates a gradual shift in control of shares from sellers to buyers. The rounding bottom pattern looks exactly like it sounds, and even though MTB's pattern is actually at the top of its recent range, the trading implications are exactly the same. A breakout above $118 is the signal that the pattern is completed and it's time to be a buyer.
With high short interest in MTB right now, a short squeeze could add some fuel to the fire on a breakout. Support looks reasonably strong at $110 -- that's the spot to keep your stop.
Starbucks
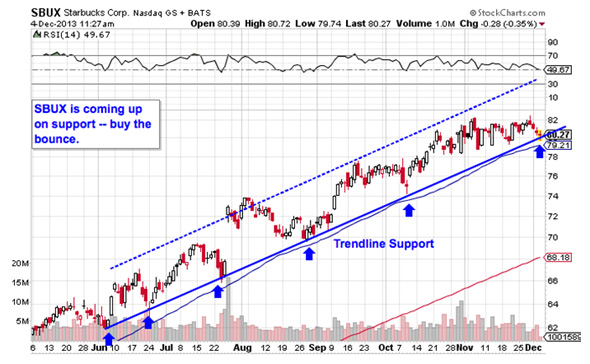
Finally, onto a bullish trade that isn't a bank: Starbucks (SBUX). In fact, you don't need much technical know-how to figure out what's going on in shares of the massive coffee-shop chain; a quick glance at the chart tells you everything you need to know.
Starbucks is currently forming an uptrending channel, a setup that provides a high probability range for SBUX's price action going forward. In a nutshell, with a price channel, up means buy and down means sell, so SBUX's uptrend is a buy right now. But the optimal time to buy comes on a bounce off of trendline support, a level that's getting tested this week.
Buying off a support bounce makes sense for two big reasons: it's the spot where shares have the furthest to move up before they hit resistance, and it's the spot where the risk is the least (because shares have the least room to move lower before you know you're wrong). Remember, all trend lines do eventually break, but by actually waiting for the bounce to happen first, we're ensuring Starbucks can actually still catch a bid along that line.
To see this week's trades in action, check out this week's Must-See Charts portfolio on Stockpickr.
-- Written by Jonas Elmerraji in Baltimore.
No comments:
Post a Comment